In our newsroom you will find news and information about Delvag.
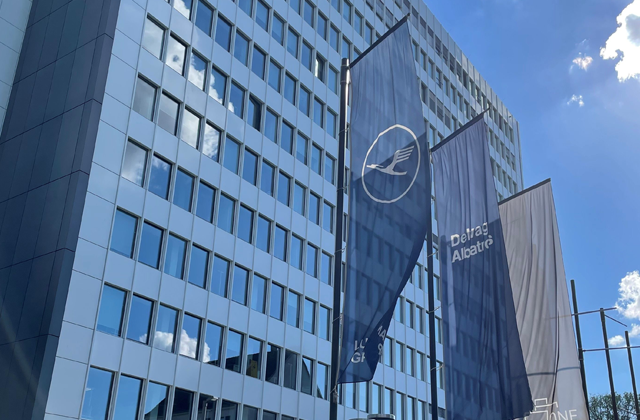
News and updates from Delvag
Our stance on the Paris Climate Agreement
We - the Delvag Group - with the companies Delvag Versicherungs-AG, Albatros Versicherungsdienste GmbH and Albatros Financial Solutions GmbH, are committed to the Paris Climate Agreement.
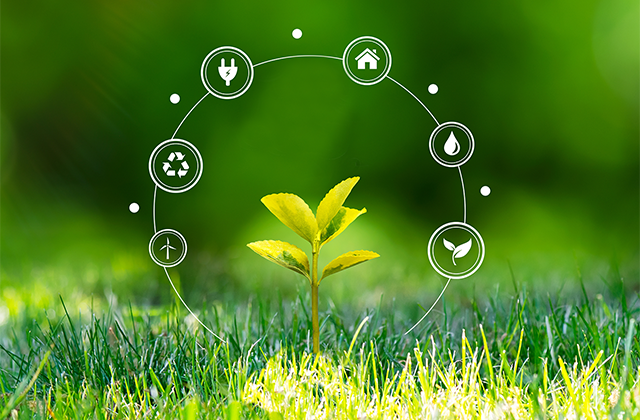
We take responsibility
As an insurer, we are aware of our corporate and social responsibility, which is why we are working together with you, our partners and customers, to transform ourselves into a more sustainable company. We show you how we integrate this into our corporate culture and processes on our "Responsibility" page. Let's shape a more sustainable future together!